Alright, folks, let’s talk Best US Airports in 2025. It’s already shaping up to be the year for air travel, and I hope you’re ready because things are about to get BUSY. After a solid 2024 (did you catch that 7% jump in air travel last spring?), all signs point to airports being absolutely packed. Lyft’s got the receipts too—rides to and from airports were up 10% in November 2024 alone. If this trend keeps climbing, we’re looking at a record-breaking travel season. Buckle up, besties!
And let’s be real—airports can make or break your trip. One minute, you’re gliding through security like a world traveler; the next, you’re stuck in a TSA line questioning all your life choices. Not all airports are created equal, and we’re here to spill the tea on which ones will have you living your best travel life versus the ones that’ll leave you crying into your overpriced airport latte.
To prep you for 2025 travels to a new gay city, we’ve ranked the 30 largest U.S. airports based on 12 juicy categories across four key vibes: convenience, affordability, efficiency, and amenities. How’d we do it? A little Lyft data magic, some public info, and a sprinkle of airport know-how. Want the full scoop on our process? Hit up the “Methodology” section below.
But enough chit-chat—let’s dive into the best (and worst) airports 2025 has to offer. Ready? Let’s go!
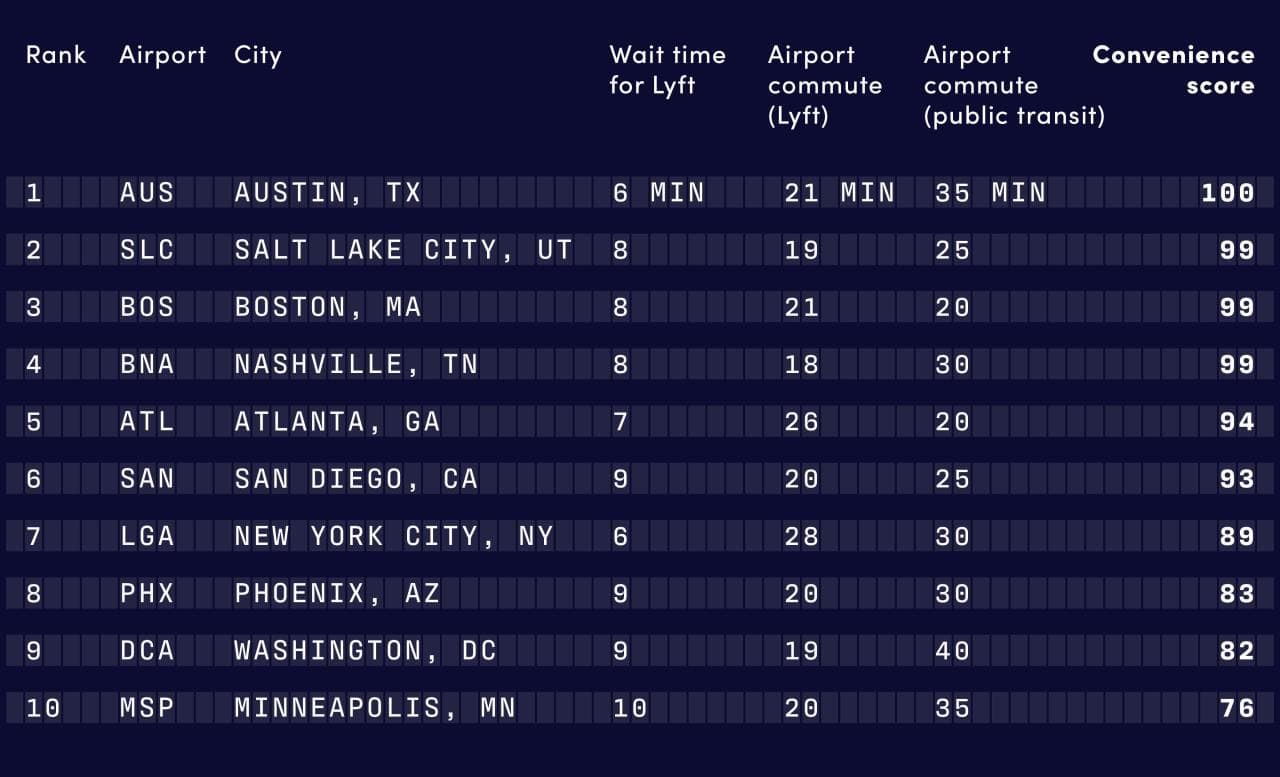
Most Convenient Airport: Austin-Bergstrom International (AUS)
Getting to the airport shouldn’t feel like a marathon. Yet, as airports are often built far from city centers, commuting to catch a flight can be tedious. But some airports make things surprisingly easy.
Here’s how we broke it down based on three metrics:
- Time by car
Lyft data reveals that the average ride to or from an airport takes 26 minutes. But Las Vegas’s Harry Reid International Airport (LAS) crushes the competition with just a 16-minute average commute! It’s a top pick for travelers looking to avoid traffic headaches.
- Time by public transit
If you’re team public transit, Boston Logan International Airport (BOS) wins big here. The subway, commuter rail, and buses provide an accessible commute to downtown in only 20 minutes—the shortest on record.
- Wait time for rideshare pickups
Rideshare waiting time is another critical factor. And here comes LaGuardia Airport (LGA) in New York, where post-renovation pickup times clock in at an impressive six minutes, compared to the nationwide average of nine minutes.
Add it all up, and AUS (Austin), SLC (Salt Lake City), and BOS (Boston) take the crown as the most convenient airports to get to and from in 2025.
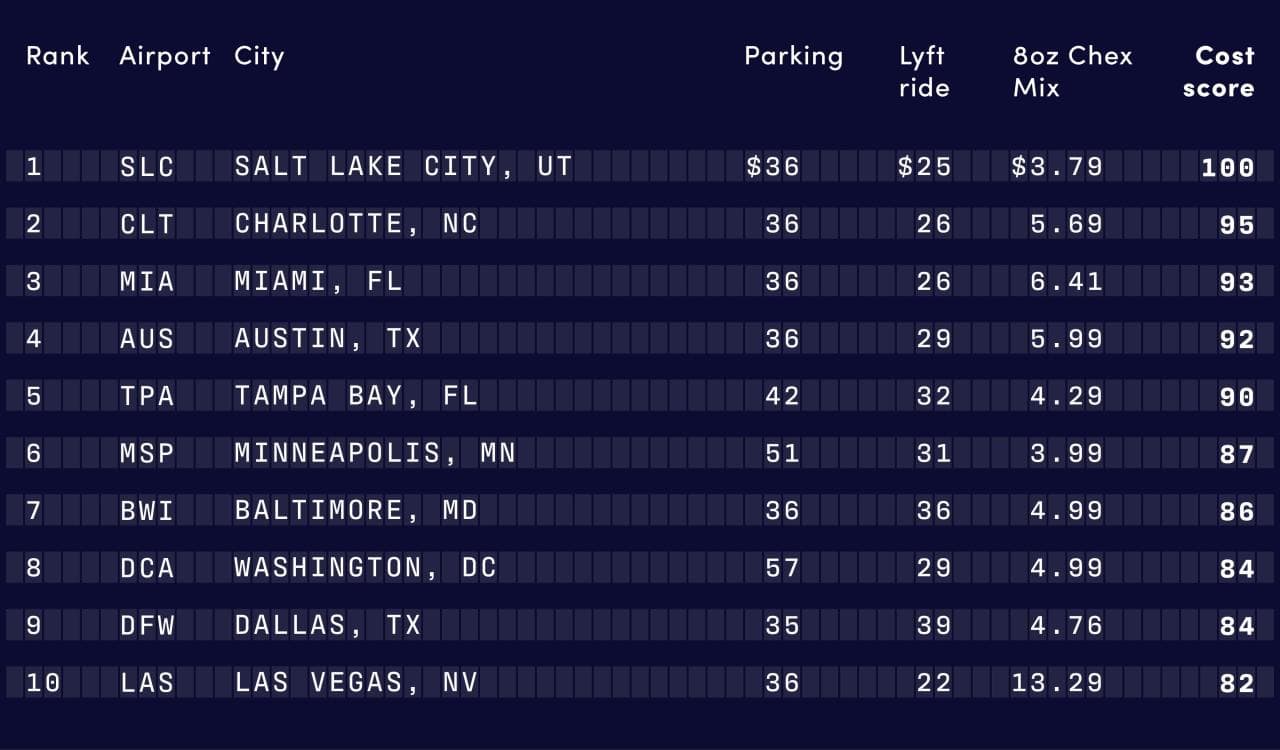
Most Affordable Airport: Salt Lake City International (SLC)
Flying costs enough—why overpay for parking, overpriced snacks, and rides? Here’s what we found when ranking the most wallet-friendly U.S. airports.
- Parking
The nationwide average for parking during a long weekend is $60. But in Houston’s George Bush Intercontinental Airport (IAH), you’ll pay just $27. Want more savings? Both Dallas Fort Worth (DFW) and Austin (AUS) offer long-term parking under $40.
- Cost of a Lyft ride
A ride to or from most airports costs around $39 on average nationwide. However, at Las Vegas (LAS), it’s a steal at just $22.
- Chex Mix, anyone?
A little snack for the plane shouldn’t break the bank, but that’s not always the case. Prices for Chex Mix can hit $8 on average, with wild spikes like $14 at Seattle-Tacoma (SEA). But SLC and Minneapolis-Saint Paul International Airport (MSP) keep their snack prices under $4.
When all factors are considered, SLC emerges as the most cost-effective airport, followed closely by Charlotte (CLT) and Austin (AUS).
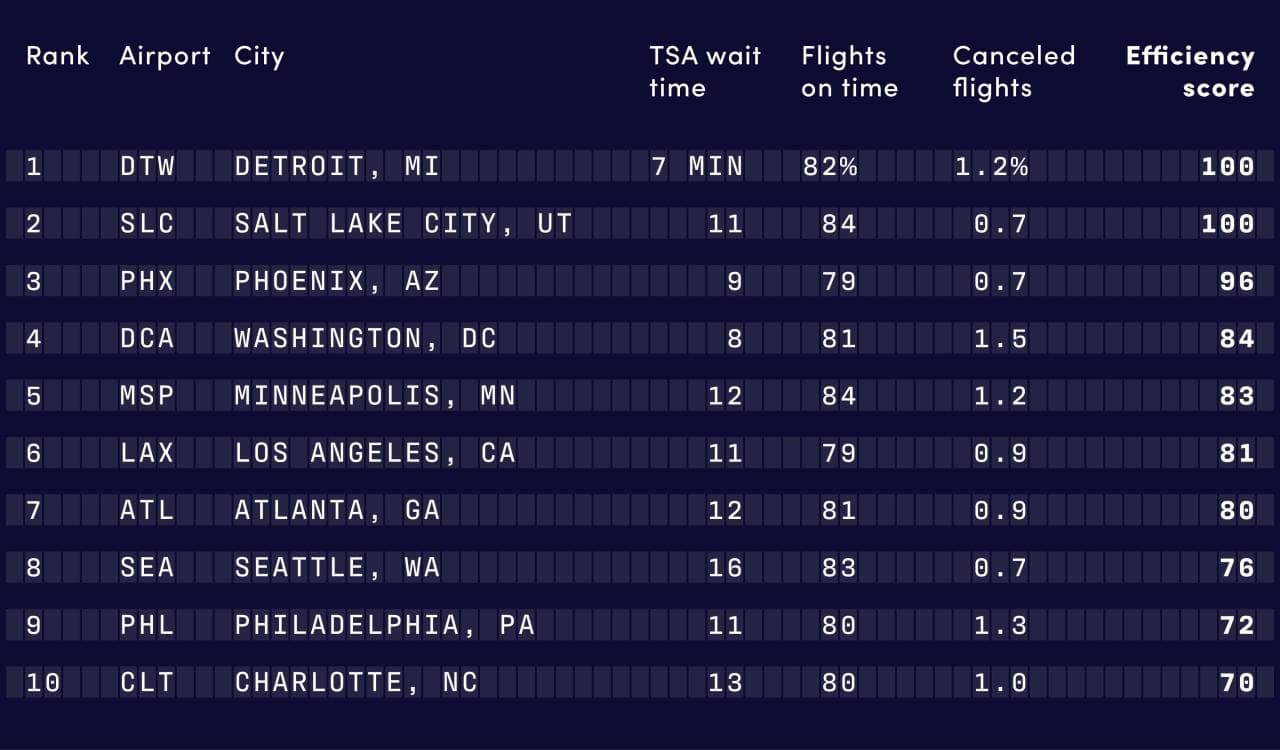
Most Efficient Airport: Detroit Metropolitan (DTW)
Nobody enjoys travel disruptions. But some airports make the process smoother than others. When assessing TSA wait times, on-time percentages, and cancellations, here’s who came out ahead.
- TSA wait times
Standing in line at TSA can feel like an eternity, but it’s surprisingly quick at Detroit (DTW), where the average wait is just seven minutes. Compare that to Austin, where travelers wait up to 20 minutes.
- On-time flights
Both Minneapolis (MSP) and Salt Lake City (SLC) boast stellar flight punctuality rates (84%), thanks to superhuman snow-removal crews and operational efficiency.
- Fewer cancellations
Sunny Phoenix Sky Harbor International (PHX) wins here with the lowest cancellation rate, averaging half the national standard.
When all metrics get crunched, DTW tops the list for efficiency, with SLC and PHX not far behind.
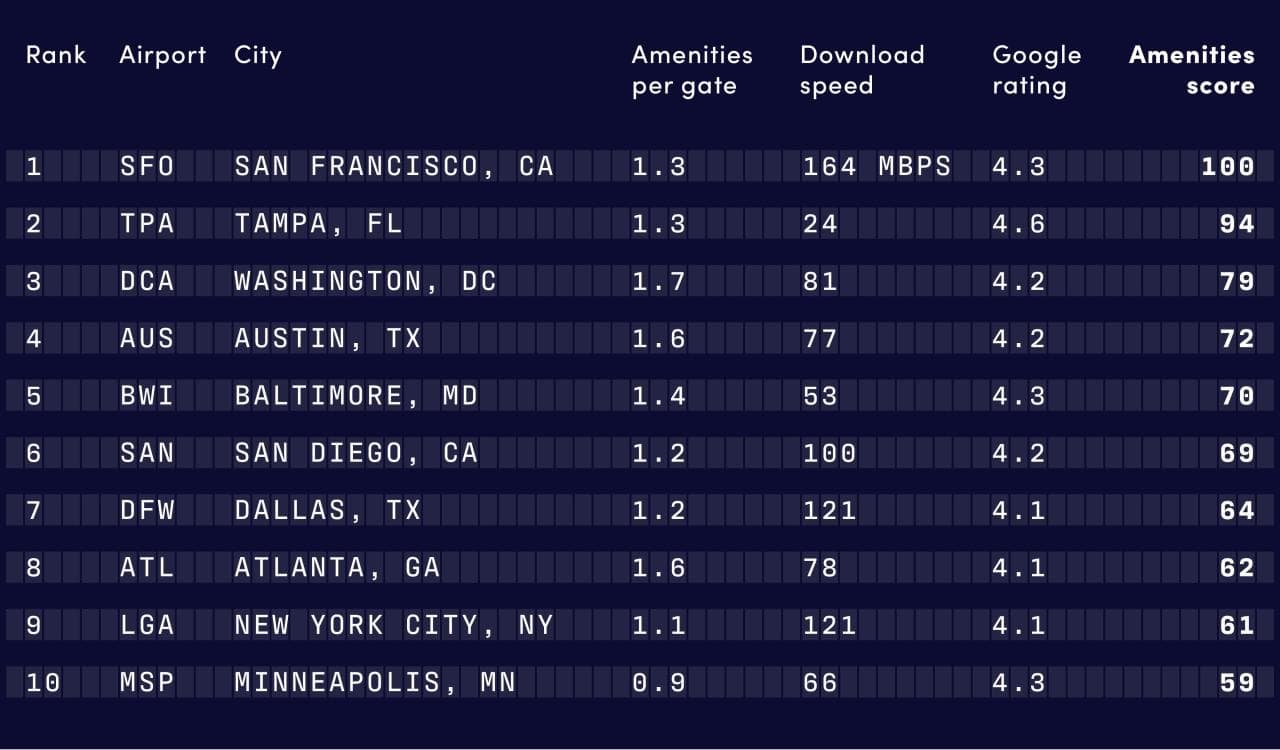
Best Amenities Airport: San Francisco International (SFO)
Extra time at an airport doesn’t have to be terrible. SFO leads the way when it comes to offering great amenities that improve your experience.
- Wi-Fi, baby!
Nothing beats fast internet for killing downtime. SFO crushes it with blazing download speeds of 162 Mbps, with close runner-up Seattle (SEA) at 139 Mbps.
- Shops and restaurants per gate
If retail therapy is part of your travel plan, you’ll love Newark Liberty International (EWR), with almost two shops or restaurants per gate—a national high.
- Overall ratings
For a comprehensive snapshot, we analyzed Google reviews. Tampa International (TPA) blew us away at 4.6 stars, praised for accessible signage, spotless bathrooms, and captivating art installations (yes, the giant flamingo!).
San Francisco (SFO) steals the show for overall amenities, with runner-ups Tampa (TPA) and Washington National (DCA) rounding out the top three.
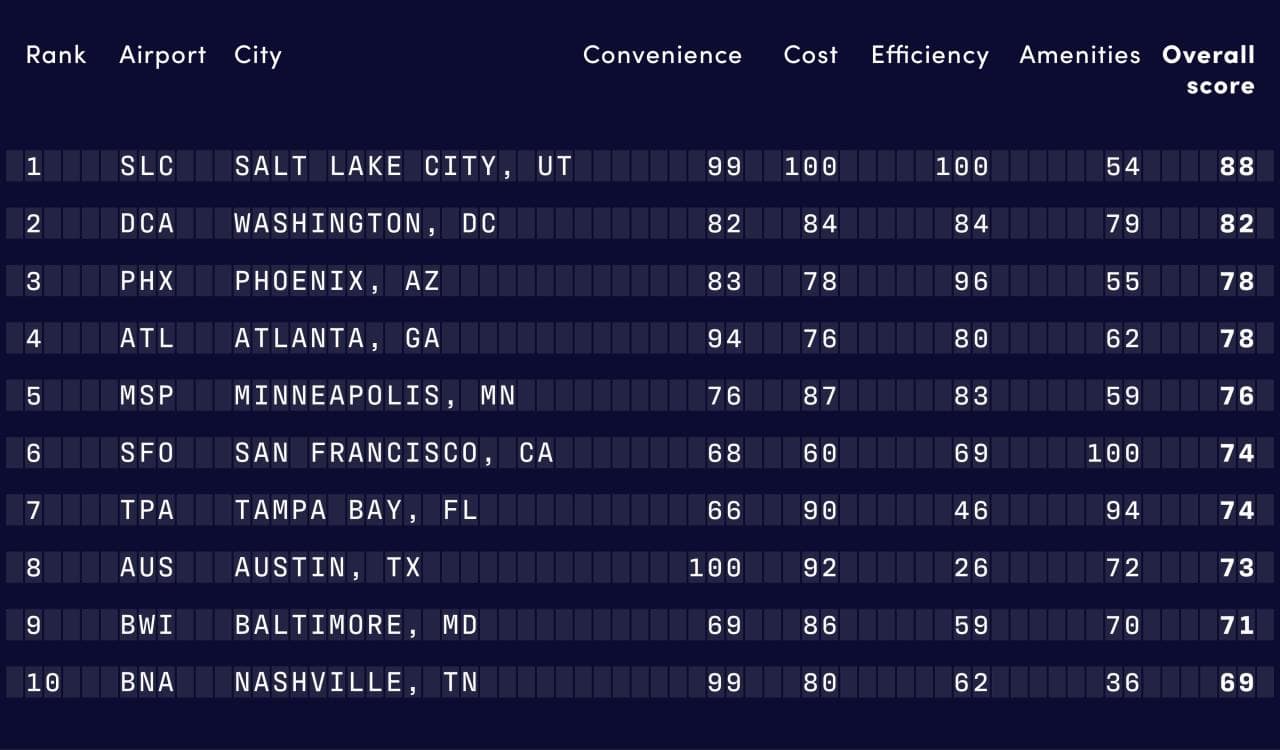
Best Airport Overall for 2025: Salt Lake City International (SLC)
Drumroll, please… Combining all the above metrics, Salt Lake City International Airport (SLC) takes home the gold for 2025. From affordable parking to top-tier efficiency and a knack for on-time flights, SLC proves why it’s a traveler favorite.
Methodology
This sample considers the 30 largest airports in the U.S. as of 2023 across the following 12 metrics:
Commute Metrics
- Average commute by car (minutes) is calculated using Lyft data, as the median length of a Lyft ride that is going to/from an airport from Nov.1, 2023, to Nov. 1, 2024.
- Shortest commute by public transit (minutes) follows the report by Travelers United and uses Google Maps to estimate the time it takes to get from the airport to the city center with public transportation.
- Average wait for pickup (minutes) is calculated using Lyft data, as the median time between when a Lyft ride is requested and a passenger is picked up from an airport from November 1, 2023, to November 1, 2024.
Cost Metrics
- Cost of parking is the average cost of parking at the airport for a long weekend in 2023, according to Upgraded Points’ data study.
- Cost of a Lyft ride to/from the airport is calculated using Lyft data, as the median length of a Lyft ride that is going to/from an airport from November 1, 2023, to November 1, 2024.
- Cost of Chex Mix is calculated using this shared Google spreadsheet from 2024, with data for additional airports drawn from comments on X and TikTok.
Operational Efficiency
- Typical TSA wait (minutes) is estimated using TSAWaitTimes, as the average wait between 6 a.m. and 10 p.m., with data collected on Tuesday, November 19, 2024.
- Percentage flights on time is calculated using data from the Bureau of Transportation Statistics, as the average across the share of an airport’s arrivals and departures that were on time in 2023.
- Cancellation rate is calculated as the rate of canceled flights for airports in 2023, according to Insuremytrips.com.
Amenities and Reviews
- Download speed is the median download speed in Q3 2022, with estimates provided by Speedtest Intelligence. For San Diego we used a proxy of 100 Mbps—the minimum speed that one can easily download and stream movies—as SAN advertises that ability.
- Restaurant and shops per gate is calculated as the number of shops and restaurants for each airport (sourced from airport websites and the 2023 Financebuzz report), divided by the number of active gates at an airport.
- Google reviews is the average number of stars for the airport on Google Maps, collected Nov. 6, 2024.
This article was originally written by Sarah Conlisk for Lyft and published on Stacker.com. It has been edited by the fagabond team for fagabond.com.


